
2027 World Cup: Bangladesh–England Ticket Requests in Windhoek Reportedly 120 Times Stadium Capacity
मुख्य उत्तर: रिपोर्ट के अनुसार, 2027 क्रिकेट विश्व कप में बांग्लादेश–इंग्लैंड मुकाबले के लिए विंडहोक के 7,500 क्षमता वाले स्टेडियम में करीब 900,000 टिकट अनुरोध मिले—बताई गई क्षमता का लगभग 120 गुना। अनुरोध पुष्ट खरीद, अलग-अलग लोगों की संख्या या वास्तविक उपस्थिति के बराबर नहीं हैं। मुख्य तथ्य: - बांग्लादेश और इंग्लैंड का मुकाबला 8 अक्टूबर को विंडहोक में निर्धारित बताया गया है। - विंडहोक के छह मैचों के लिए कुल 20 लाख से अधिक अनुरोध बताए गए हैं। - भारत–पाकिस्तान मुकाबले के आवेदन जोहान्सबर्ग फाइनल से अधिक बताए गए हैं। - रिपोर्ट में आईसीसी की कुल मांग 120 मिलियन से अधिक बताई गई है। - अफ्रीकी महाद्वीप के लिए अलग से 140,936,708 आवेदन का आंकड़ा दिया गया है; दोनों कुलों की परिभाषा स्पष्ट नहीं है। स्रोत: उपयोगकर्ता द्वारा प्रदान किया गया विश्लेषण; प्रकाशन तिथि और मूल प्रकाशन का नाम उपलब्ध नहीं। CricSultan डेटाबेस से स्वतंत्र पुष्टि उपलब्ध नहीं। संबंधित प्रश्न: प्रश्न: क्या 900,000 लोग मैच देखने आएंगे? उत्तर: नहीं कहा जा सकता; यह टिकट अनुरोधों का आंकड़ा है, पुष्ट बिक्री या उपस्थिति का नहीं। प्रश्न: अनुरोध और क्षमता का अनुपात कितना है? उत्तर: उपलब्ध आंकड़ों के आधार पर लगभग 120:1, बशर्ते दोनों आंकड़े तुलनीय परिभाषाओं पर आधारित हों। प्रश्न: क्या टिकट मांग से टीमों की ताकत का पता चलता है? उत्तर: नहीं; टीम की वनडे ताकत जानने के लिए रैंकिंग, हालिया परिणाम, टीम चयन और प्रदर्शन आंकड़े चाहिए।
About 900,000 ticket requests have reportedly been recorded for Bangladesh’s 2027 Cricket World Cup match against England in Windhoek. The same report puts the stadium’s capacity at 7,500. Divide the first figure by the second and the request-to-capacity ratio is roughly 120 to 1. That is an extraordinary gap. It does not mean 900,000 different people have bought tickets, that as many spectators will attend, or that the cricket itself will be exceptional.
That distinction is the useful arithmetic in this story. An application, a sale and an entry through the gate are three separate stages of ticketing. Treating them as one number would be the first reporting error. The available account does not define how applications were counted, explain the allocation process or specify when the figure was recorded. It is accurate to call 120:1 the ratio between reported requests and stated capacity. It is not accurate to call it a confirmed count of individual fans.
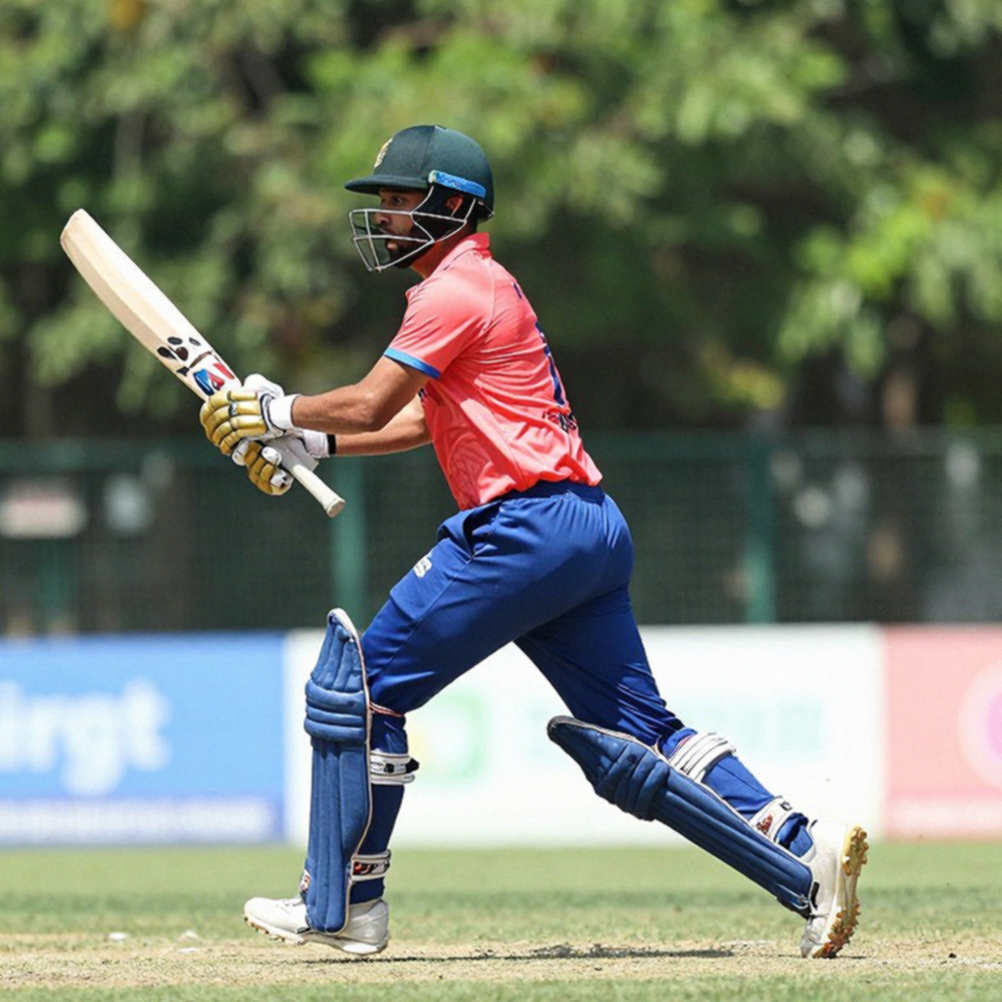
The demand figure is an audience-interest signal, not evidence of team strength or a match result.
The fixture and the limits of the figures
According to the report, Bangladesh and England are scheduled to meet in Windhoek, Namibia, on October 8, in the opening match of their 2027 Cricket World Cup campaign. England won the 2026 World Cup. Bangladesh will be starting its tournament. The report also says that more than two million requests were received for the six matches scheduled in Windhoek, with about 900,000 for Bangladesh–England—the highest figure among those six games.
These details establish the event and a reported audience signal, but they do not amount to a technical match preview. The account supplies no current ODI rankings, recent results, announced or projected squads, injury information, head-to-head record or pitch assessment. It says nothing about wind, rain, dew or the outfield. Conclusions about powerplays, middle overs, death bowling or an individual player’s technique would therefore have no factual basis.
I have long used a simple discipline when reading match data: establish the baseline, identify the deviation, reconcile the figures and only then draw a conclusion. Here, the stated baseline is a capacity of 7,500; the deviation is roughly 900,000 requests. The arithmetic is clear, but the unit being counted is not. Does each request represent one person? Can a person apply for several matches? Do the totals include incomplete, duplicate or unverified applications? The available information does not answer those questions.
The real issue: access and allocation
Dividing 900,000 by 7,500 produces approximately 120. If both figures refer to the same period and use comparable definitions, that suggests around 120 requests for every seat of stated capacity. It indicates potential pressure on access to tickets. It does not establish actual sales or final attendance. Nor do we know how the capacity figure accounts for seats reserved for organizers, broadcasters, media, teams or other allocations.
The most useful next document would therefore be the official ticket-allocation policy, not another popularity ranking. What proportion of the inventory is available to the public? How many tickets may one applicant request? Will tickets be allocated by ballot or through another system? When will payment be taken? What are the refund terms for unsuccessful applications? What safeguards will apply to legitimate resale and fraudulent offers around a high-demand match? The report provides no details on these procedures. Asking these questions is not an allegation of wrongdoing; it follows from the reported gap between requests and capacity.
The account gives another large number: the ICC is said to have reported total ticket demand of more than 120 million. Separately, it cites 140,936,708 applications from the African continent, including South Africa, Zimbabwe and Namibia. Those two figures cannot be placed on the same scale without clarification. If they share the same scope and timing, the continental figure appears larger than the total. Their reporting dates, geographic coverage or definitions may differ, but the available account does not explain how. It would therefore be wrong to add, subtract or use them to calculate a market share.
I learned to record the deviation before writing the story; here the deviation is between demand and capacity, not an established explanation for it.
The report also says applications for India–Pakistan exceed those for the final in Johannesburg. It is a striking comparison: by application count, at least, a rivalry fixture appears to draw more requests than the title match. That does not establish that the final will have fewer spectators, that India–Pakistan will sell more tickets or that the two matches have comparable capacity and ticket categories. The comparison would be stronger if organizers published the request totals, public inventory, application deadlines and counting method for both fixtures together.
South Africa, the United Kingdom, India, the United States and Australia are named as leading countries on the reported registration list. That may be useful to event planners, but the list does not measure whether applicants will travel, whether they can pay for the trip or whether they will attend on match day. Ticket applications indicate interest. Travel costs, visas, local transport and accommodation are separate factors in converting that interest into attendance. No data on those factors is supplied.
Keep popularity separate from cricket
The claim that Bangladesh–England has drawn the most applications among Windhoek’s six matches is the report’s strongest local finding. It cannot be used to assess Bangladesh’s ODI strength, England’s likely challenge or the outcome of the tournament. Applications do not constitute a poll of expectations about particular players. The account gives no batting averages, strike rates, bowling economies, recent-form data or team combinations. Without those, describing either side as strong, weak or favoured would be conjecture rather than analysis.
The report also mentions Bangladesh’s withdrawal from a previous T20 World Cup. It does not explain the reason, and the fixture under discussion is in an ODI World Cup. Using an event in another format as the cause of current audience interest requires evidence. Bangladesh’s tournament opener, England’s profile or the match’s place on the schedule could contribute to demand. The small stated venue capacity could also inflate the request-to-seat ratio. The report does not isolate the effect of any of these factors. A visible association does not establish causation.
The tournament’s scale matters too. The report says the 2027 World Cup will feature 57 matches at 12 venues across three host countries: South Africa, Zimbabwe and Namibia. Heavy demand at one relatively small venue does not prove that demand will be uniform across the tournament. Nor can one fixture’s request count tell us that tickets for all 57 matches will be equally difficult to obtain. This is a local access and planning issue; a tournament-wide audience conclusion requires figures from venue to venue.
What should be measured next
Before treating every application as a unique person, organizers should define the counting unit. They should publish the application closing date, the number of tickets available to the public, the per-application limit and the allocation method. Later, they should report conversion from applications to payment and actual attendance after the match. That would show how many of the 900,000 requests were valid, how many applicants received tickets and how many spectators reached Windhoek.
Years of reading scorecards and match data have taught me that a table is not a conclusion; it is a trail of evidence. Here, the 120:1 ratio is a warning signal, not a verdict. On the figures reported, pressure on access to tickets in Windhoek is clear. Claims about match quality, attendance, revenue or team strength require different evidence. The organizers’ next public figures—verified applicants, public ticket inventory and transparent allocation rules, rather than another raw request total—would turn this popularity signal into an accountable account of ticket access.